Project in: Marketing, Communications, Social Change
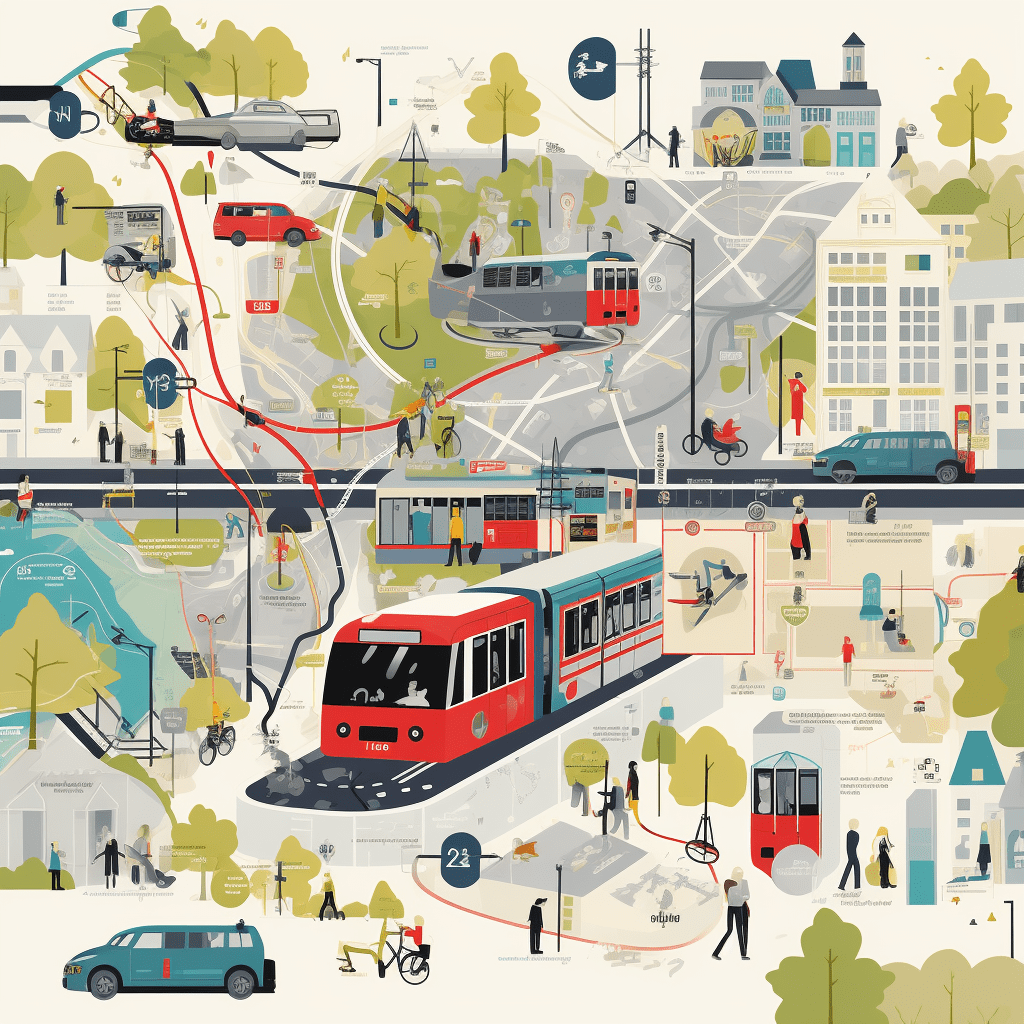
Christchurch, while not the largest city in New Zealand, is certainly falling victim to urban sprawl, maximised by a lack of sustainable transport usage across the great Christchurch region. Although significant investment needs to be made into public transport for the future of Christchurch’s development, this campaign focuses on increasing the uptake of public transport, and encouraging the use of sustainable transport methods among students in the area.
This project was undertaken as part of a marketing course at the University of Canterbury which focused on social change. A full outline of the report is provided bellow, as well as a PDF version for anyone wishing to view it [Identifiable or confidental elements have been redacted].
1. Background Infromation
In New Zealand, cars and private vehicles far outpace sustainable transport methods, such as buses, cycling, and walking (EHINZ, 2018). At a time when climate change and higher fuel prices are often at the forefront of the people’s minds, why do we see such a considerable proportion of the population selecting cars over sustainable and often cheaper options? This report seeks to explore this concern, and address such through a campaign aimed at encouraging the use of sustainable transport options in Christchurch.
1.1. State of Sustainable Transport in Christchurch
Christchurch’s public transit is operated by two carriers under the name ‘Metro’, operating bus lines and a ferry line. Metro currently operates 29 bus routes with 2063 stops within the city and surrounding area (Metro, n.d.-b; Moovit, 2023a). For the reason of simplicity, references in this report made to sustainable transport refer to only the bus lines operated by Metro, as well as cycling and walking. The city has over 60km of dedicated cycleways [cycle lanes separated from the road entirely] and double this number in cycle lanes (Christchurch City Council, 2023a). Since the 2011 earthquake, Christchurch has seen a downward trend of sustainable transport use (Greater Christchurch Partnership, 2021). As of 2018, 72.9% of Christchurch residents use a private or company vehicle, with only 14.9% taking sustainable options (Statistics NZ, 2018b).
1.2. Epidemiology of the Problem
There are three key factors which have led to higher rates of unsustainable transportation use in Christchurch.
- Automotive dominance: Private vehicle use is the primary mode of transportation, leading to more investment car-centric policies and influencing of cultural norms which propagate positives of car ownership.
- Limited Infrastructure: While operating more bus stops, comparatively less bus lines are run than other regions (Moovit, 2023b). Although new cycling/walking infrastructure has been created, there is a lag between its creation and uptake.
- Urban Sprawl: Christchurch has significantly lower density than other major New Zealand cities, despite being the second largest by population and area. This has led to a reliance on cars due to a lack of sustainable transit accessibility, and sustainable transit trip times being longer than that of cars
1.3. Risks of the Problem
While risks of not adopting sustainable transport options are not often considered by citizens, there are multiple significant potential impacts:
| Risk | Explaination |
|---|---|
| Environmental Degradation | The continued overreliance on cars will result in worsening air pollution and greenhouse gas emissions, exacerbating the effects of climate change. |
| Congestion of Roadways | Congestion is likely to worsen on major routes as the population grows, leading to longer wait times. |
| Potential Health Impacts | Increased air pollution from car use may lead to respiratory problems. Car users are at a higher risk of sedentary lifestyles, making them more prone to obesity or other health problems. |
| Potential Economic Impacts | Higher car use results in more frequent damage to roadways, resulting in higher costs to maintain, costs which are often passed onto residents through rates. |
2. Target Audiences
2.1. Potential Target Audiences and Their Charateristics
social marketing campaign promoting sustainable transport options in Christchurch provides a variety of different characteristics. Christchurch is significantly less dense than other cities in New Zealand resulting in a sizeable number of commuters being rural residents. Rural residents struggle with challenges such as limited transportation options and longer commutes in comparison to those who live in the city centre. These challenges create a reliance on cars due to a quicker commute to a desired destination compared to bussing, walking, or biking. Urban commuters also face issues with sustainable transport such as traffic congestion and higher transportation costs. Urban commuters who live more in the city typically consist of working-age adults with diverse backgrounds and varying income levels. Students and youth who are spread across the city in large to moderate numbers suffer from budget restraints and potential environmental concerns. A large majority of students also choose the option to drive even though sustainable transport options are available to them.

2.2. Primary Target Audience and Justification
A general TARPARE analysis (Donovan et al., 1999) of potential audiences was undertaken [see table 3] to determine potentially receptive audiences. To promote the use of sustainable transport in Christchurch, University students were chosen as the primary target audience of this campaign, due to their size, persuasibility, and distinctive vulnerabilities. A secondary TARPARE analysis was done to focus specifically on students [see table.4], revealing they are more likely to be persuaded than other potential groups, and can help reduce both current and future problem costs if intervened with [see table.4]. Students are typically on tighter budgets and may often choose personal vehicles even though they have alternative options. Students are much more susceptible to influence making them receptive to long-term behaviour change. Focusing on this group increases the potential for impactful change, tackling urgent transportation concerns and encouraging sustainable habits for Christchurch’s brighter future.
2.2.1. Knowledge, Attitudes & Behaviours
From the class survey, the knowledge of sustainable transport among the target audiences becomes clearer. Fifty percent of survey participants believe that driving is not more cost-effective than taking the bus in Christchurch (See Figure.1). Bussing is considered a cost-effective alternative in comparison to personal driving. When it comes to the main barriers to using sustainable transport such as bussing, 85.7% found that it is too time-consuming whilst 64.3% find it not accessible (See Figure.4).
Students in a university setting may be more influential in sustainable transport campaigns. Students may be more convinced to use sustainable transport due to budget constraints, convenience, or even environmental concerns. Although possible, they are likely limited by funds or infrastructure barriers. This means that when targeting students it would involve an emphasis on cost-effectiveness, and environment friendliness which are factors they feel at risk to. Students are also aware of the advantages and risks of sustainable transport such as cost-effectiveness or feeling unsafe. The campaign would need to appeal to students’ needs and preferences to ensure better behaviour and attitude towards sustainable transport.
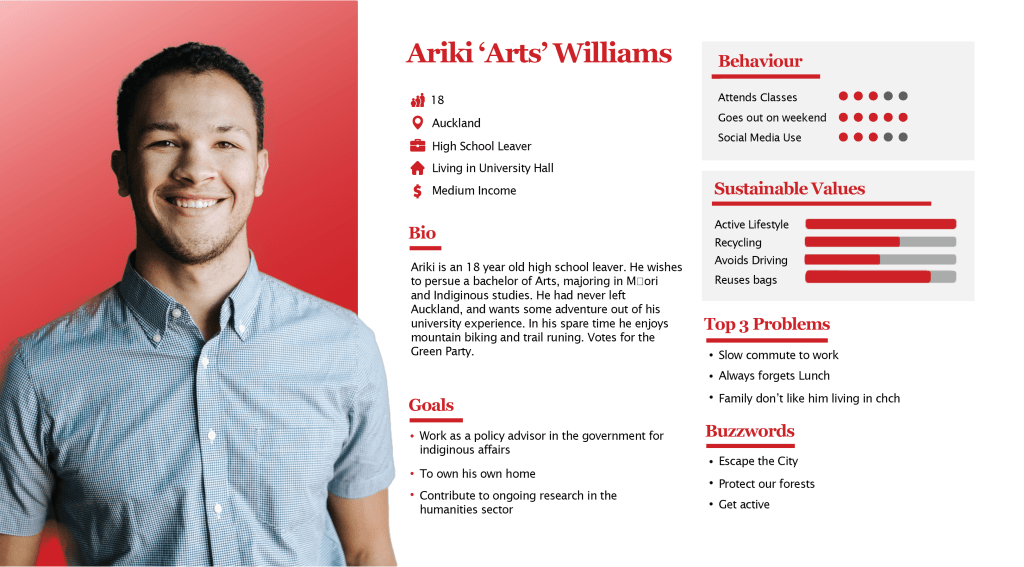
2.2.2. Target Audience Personas


3. Campaign Goals
We have broken down our overall mission into three goals, behavioural, knowledge, and attitude. These three goals help to give our campaign direction when trying to achieve the overall goal of increasing sustainable transportation usage. By using SMART goals, we can create an effective campaign as we have a clear understanding of what is to be achieved.
| Behavioural | Over the next 3 months, we are aiming to increase sustainable transportation usage by 20% among university students, specifically new students, via campaigns and incentives that are consistent with our overall goal to decrease private vehicle usage in city areas. |
| Knowledge | Within 3 months, we aim to inform 60% of our target audience about the benefits of using sustainable transportation, through educational campaigns and digital channels |
| Attitude | We aim to increase positive attitudes towards sustainable transport by 15% within the next 3 months through the implementation of persuasive messaging, focusing on the cost-effectiveness of sustainable transport, as well as the environmental benefits that it offers. |
We have chosen a 3-month period for this campaign. This allows time to initiate phases throughout the campaign without overwhelming the priority group. It allows for enough time for campaign awareness to build and potentially start changing attitudes and behaviours towards sustainable transportation. A short time period was chosen to avoid desensitisation and information fatigue. The percentage of the change we want from our priority group differs over the three goals as we recognise that certain changes, especially behavioural, will be difficult to make. We have created these goals as they are both attainable for our campaign and priority group.
4. Previous Campaigns

A past campaign on sustainable transport that was successful was Portland’s SmartTrips in 2013 (Boddy & Kassirer, 2013). This social campaign was created to increase the amount of sustainable transport that was being used in the Portland area and decrease the amount of VMT [vehicle miles travelled].
This campaign was specifically focused on the new residents of Portland, as it was easier to introduce a new behaviour to ‘newcomers’ rather than stop behaviour for current residents. There were three key organisations involved in this campaign. It was initiated by the Portland Bureau of Transportation, partnered with Metropolitan Planning Organisation and Oregon Department of Transportation (Boddy & Kassirer, 2013). All involved understood current transportation problems within Portland and what could be improved. Key aspects that were used within the campaign were feedback, incentives, prompts, and effective communication with the target group of new residents (Boddy & Kassirer, 2013).
This campaign was seen as a success. There were around 5,400 participants, of which 10.5% ordered materials that could benefit their transition to sustainable transport. There was a decrease of more than 1 million VMT [vehicle miles travelled], roughly 200 miles per new resident, each year. In the first-year solo, driven trips decrease by 10.4%, and then by 7% in the following year. Finally, sustainable transportation by new residents increased by 13.6 and then by 9% the following year (Boddy & Kassirer, 2013). The theory of reasoned action is evident within this campaign. By changing new residents’ perceptions and making sustainable transport the norm for their group, people are more likely to adopt a behaviour.

5. Marketing Strategies

Product
Positive transport behaviours are aimed to be achieved through 3 interventions, an education campaign, offering direct access to transport cards, and an organisation.

Promotion
Pamphlets, posters, event engagement, and digital media will be the main methods of promotions.

Price
Many students do not know how inexpensive sustainable options are as they do not use them, therefore, the education campaign is a core component.

Stakeholders (People)
Ridesharing services may oppose or try undercut our campaign efforts, while local councils and government ministries will be our best option for support.

Placement
Print advertising will be placed near the university campus, central business district, and popular student areas. Online targeted advertising will also take place.

Policy
Working with the ministry of transport and ministry for the environment would be benificial to the campaign.
5.1. Product

5.1.1. Desired Behaviour
Through this social marketing campaign, the desired behaviour is for students to increase their usage of sustainable transport, specifically bus usage by 20% [see section 3]. This will be achieved by offering interventions which increase student’s knowledge of sustainable transport, foster positive attitudes towards it, and remove potential barriers to its usage. New university students are exposed to various transportation options as they enter a new living area, this encourages their adoption of new behaviours, and behaviour modification. By integrating knowledge, trends, and the specific marketing to increase bus usage, students are likely to adopt the encouraged behaviour.
5.1.2. Interventions
In halls, many students arrive without personal transport options, resorting to using public transport, purchasing a bike, purchasing a car, or walking. This campaign uses three key interventions: an information campaign, welcome packs for students, and a trial of student organisation dubbed “UniCruise.” These will provide the target audience with information on how to efficiently use Christchurch bus routes and cycleways, to encourage the use of sustainable transport, and offer free transit from the university to events which students may be interested in.
| Information Campaign | Pop up information stalls at events (at UC, Careers expo, etc)Adshel signage at Bus Stops, Billboards, etcOnline ads, and social media account(s) |
| Metro Welcome Pack for Students | Tertiary MetroCardPamphlet specific for university students (routes, locations, etc) Pamphlet about other sustainable transport options (including borrow a bike scheme) |
| “UniCruise” Student organisation Trial | Offer free or organised transport to events which students may be interested in (i.e., Rolling Meadows, Electric Ave, Rugby)Offer a Friday/Sat bus from university halls to the CBD.Promote through UC |
Welcome Packs
New students will be provided with welcome packs that include two pamphlets and tertiary student MetroCard.

The first pamphlet will outline commonly used Metro routes used by students, locations of the nearest bus stops and a bus timetable. It will also highlight locations of interest such as supermarkets, bars, etc which may be of interest to students living in halls, and how to get there using buses. The second pamphlet will include information on other sustainable transport options, such as biking, indicating the different cycleways in Christchurch and where they are located. It will also inform students about the Borrow-A-Bike scheme (University of Canterbury, 2023a), which provides students with bikes, helmets, and locks for free use from the university.

“UniCruise” Student Organisation
UniCruise is a student organisation which will provide University of Canterbury student ID holders with free organised transport.
This will take them to student attended events, such as rugby games and local music festivals to encourage sustainable transport options rather than driving. It will also offer a one-way bus line to the CBD on Friday/Saturday nights from campus to encourage students to use public transport when going for a night out at bars, rather than taking an uber or rideshare. UniCruise will be offered to students for the three months this campaign is running, with the potential for the it to continue it after the campaign if uptake is successful.
5.1.3. Value Exchange
By implementing these interventions, the aim is to provide students with a functional value exchange. Driving is often considered the easier option when travelling, so to change students’ behaviour this campaign needs to try and eliminate the inconvenience of using sustainable transport. By providing new students with information packs alongside an informational campaign, it offers an information and attention exchange. Although some students will not want to give up certain costs, the option of UniCruise is designed to offer a functional service which hopes to instil normative sustainable transport behaviours, potentially moving individuals who are more resistant to giving up costs, to be more open to them in the present and future.
Table 5.
Value Exchange using costs and benefits.
| Concept | What is Exchanged |
|---|---|
| Costs | Potential small financial cost (bus fare, bike purchase). Time to learn about transport options. Time to get to destination. Personal autonomy if using public transport. Personal space |
| Benefits | Reduced overall financial costs (less petrol or rideshare use). Knowledge of the city resulting in better transport choices. Cleaner air. Reduced congestion. Positive feeling from engaging in sustainable activities. Approval from others for perceived behaviour. Personal enjoyment for engaging in exercise, or from being social taking public transport in groups. |
5.2 Price

5.2.1. Costs to the Target Market
Driving a personal car is often preferred by individuals as it is more convenient and timelier than using sustainable transport (Australian Bureau of Statistics, 2008). When driving, there is often no preplanning needed, you can get in your car and go where you like. Instead, when using sustainable transport, individuals need to find the right route, cycleway, or walk to the bus stop, and wait for the bus to come. Because of this, the main cost associated with using sustainable transport for the target market is the time and effort it will take compared to the competing behaviour of driving a car.
5.2.2. Barriers Preventing Adoption
Other barriers preventing the target market from adopting this behaviour include a range of tangible and emotional barriers. The objective of this campaign is to recognise and reduce these barriers to change the social norm from driving to using sustainable transport options.

Tangible barriers for using sustainable transport include the lack of accessibility and financial expenses associated with it. With the focus of this campaign being on new students moving to Christchurch it is likely they lack knowledge about the bus routes and cycleways that are available to them, causing them to believe they are not accessible. As mentioned above, to try and minimise this barrier students will be provided with information regarding the metro services that are available, with maps of the routes and stops that go across Christchurch, as well as information on cycleways. Another tangible barrier to students using sustainable transport is that it can be expensive, especially when considering the price of purchasing a bike or scooter. Due to the budget constraints of students, it is important to make them aware of the inexpensive sustainable transport that is available to them. These include the Borrow-A-Bike scheme, as well as the tertiary student MetroCard which lowers student bus fares to $1 (Metro, n.d.-a; University of Canterbury, 2023a)
From survey results, emotional barriers include feeling unsafe when cycling and ‘uncool’ when using sustainable transport. To try and minimise the safety concerns, this campaign will highlight the safety of dedicated cycleways in Christchurch. Information will also be provided to students on how to stay safe when cycling by utilising established information from the Christchurch City Council and University of Canterbury (Christchurch City Council, n.d. -b; University of Canterbury, 2023a) Regarding students feeling ‘uncool’ when using sustainable transport, this campaign will aim to normalise its use. This will be done through promotional methods such as events at open days and the use of UniCruise to support and encourage the use of sustainable transport and promotional efforts to reduce stigma around it [See section 5.4 – Promotion].
5.3. Placement

The most common place individuals are going to make decisions about engaging in using sustainable transport options are their homes, for new university students this is commonly the halls of residence. Other locations may include the university or areas within walking distance of the Ilam area. For new students, these locations are where they will spend much of their time. The campaign will focus on distributing the product at the halls of residence, university, and surrounding area, making information readily available to new students in their most occupied spaces. Tangible items associated with this campaign, such as information pamphlets and university metro cards, will be provided at the halls of residence when the students first arrive and at the university during orientation day and other student events.
Table 6.
Product placement locations
| Intervention | Product | Placement |
|---|---|---|
| Information Campaign | Pamphlets | Handed out at events, in Welcome Packs, in campus brochure holders. |
| Posters and Adshels | Bus stops near university and in the CBD, walls inside/near halls of residence, UC campus. | |
| Event Engagement | UC Campus open days, O week, workshops. | |
| Digital Media | Online and social media ads, social media posts, UC website | |
| UniCruise Organisation | Friday/Saturday CBD Bus | Halls of Residence |
| Event Buses | UC Haere-roa Car park | |
| Welcome Packs | Welcome Packs | Halls of residence bedrooms |
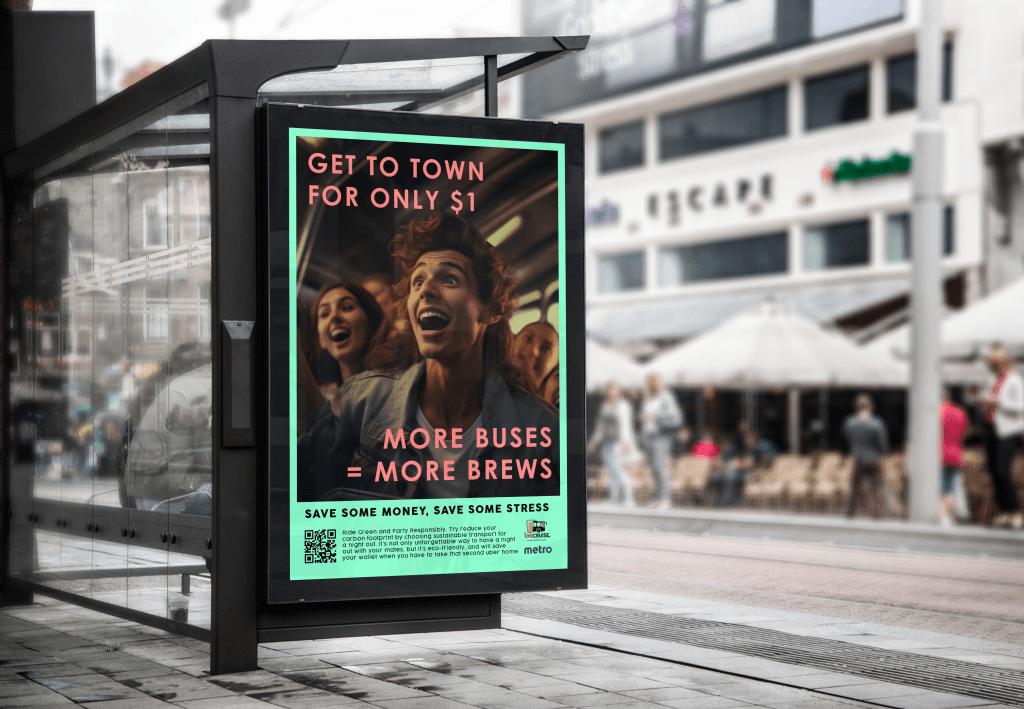
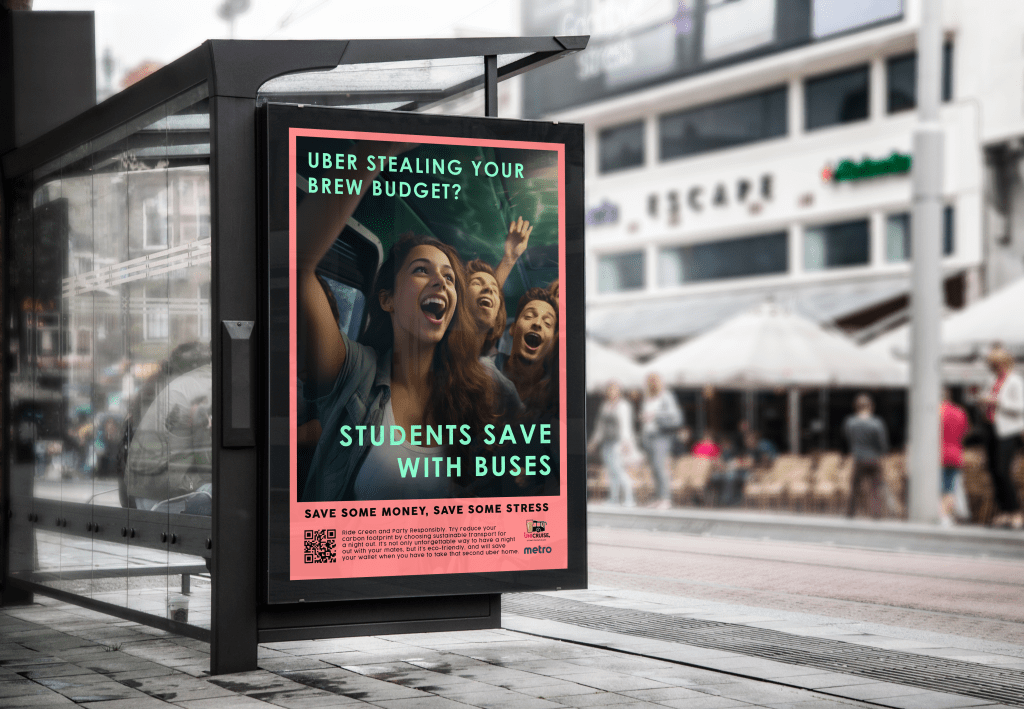
5.3.2. Example Adshels and Placement
5.4. Promotion

5.4.1. Communicaiton Objectives and Key Messaging
| Goal | Communication Objective | Associated Message #1 | Associated Message #2 |
|---|---|---|---|
| Increase Sustainable Transport usage by 20% among target audience | Encourage people to consider using sustainable transport options. | Why take an uber on a night out when you could save money with a bus? | Every Ride Counts: Increased sustainable transport usage and reduces your carbon footprint. |
| Inform 60% of the target audience about the benefits of Sustainable Transport | Increase the awareness and visibility of sustainable transport options. | Stress Less, Save More: opt for sustainable transport to get around Christchurch. | Did you get the memo? Get around with Metro! Christchurch has a wide bus network that’ll help you discover the city and get you where you need to go. |
| Increase positive attitudes towards Sustainable Transport by 15% | Make sustainable transport options appear accessible, dependable, and cool. | Get on board! Look out for your welcome pack to find exclusive student bus cards and all the information you need for eco-friendly commuting. | Join UniCruise, Join the Movement! UniCruise offers free buses for a fun night out, making sustainable transport fun!” |
5.4.2 Competition
The competitive climate includes rivalry between substitute transportation options, such as rideshare services and personal transportation, as these offer a convenient travel option with no requirement of behaviour modification. Personal transportation options also have a distinct perceived value to them, with limited negative association and increased positive association due to the numerous factors. Sustainable transport is also perceived as inconvenient, and it may require more planning, have less space, and arrive at a delayed time. Many personal vehicles are not perceived to be unhygienic, unlike sustainable transport options that may have reminisces of rubbish, sweat, and odours lingering from past riders that deter future usage and create an unpleasant experience during use.
5.4.3. Promotional Marketing Strategies
- Pamphlets: designed specifically for University Students. These will highlight routes from university accommodation bus stops. Allowing students to understand where their closest bus stop can bring them, encouraging adoption of the desired behaviour.
- Posters and Adshels: an easy, diverse marketing strategy that increases direct awareness surrounding the desired behaviour.
- Event Engagement: Pop up stalls during student events. Providing information and someone to talk to, encourages the adoption of the desired behaviour.
- Digital Media: Social media pages for “UniCruise” on Facebook, Instagram, and TikTok will feature promotional and informative material. Some print posters will be converted to ads for targeted awareness advertising through platforms such as Facebook, google, TikTok, and other social media. This allows a range of information access to a greater audience.
5.4.4. Rationale
Our marketing strategies are crafted to engage individuals and promptly communicate our key messages. Increasing the perceived value of sustainable transport is the main objective, as without acknowledging the benefits individuals receive from sustainable transport usage, sustainable usage will remain idle. It is recognised that knowledge of options and transport services is often a significant reason why people are unable to perceive the value sustainable transport may give them. By providing knowledge through events, posters, pamphlets, and other promotional strategies, we can increase the perceived value, making the target audience more open to addressing the behaviour. These visual materials also focus on value-expressive and positive emotion appeal which may make the perceived value more desirable (Quester et al., 2014, p.358; Kennedy, 2023, p.29). Other successful campaigns have often introduced similar strategies of utilising heavy information campaigns combined with audience specific interventions (National Social Marketing Centre, 2010). Our campaign also seeks to establish a normative influence by creating reference groups (Quester et al., 2014, p.460) through interventions such as UniCruise. Through encouraging value recognition, the target audience will understand that bus routes offer a cost effective, simple, effective transportation option.

5.5. Stakeholders

5.5.1. Potential Threats
A potential threat to our campaign would be Uber or ridesharing companies. Our introduction of UniCruise provides students with a cheaper, more sustainable alternative of transport when travelling from UC halls to the CBD. Ridesharing services are popular among students who may not have the ability to drive to the CBD or consciously choose not to. Introducing a service that directly targets students creates competition with ridesharing services, putting them at risk of potential business and revenue loss. The cost effectiveness of UniCruise also poses a threat to Uber specifically (McFarland, 2019; Uber Technologies Inc, 2021). Students who suffer from financial barriers will favour transportation that provides a similar service at a lower price. This cost-effective advantage once again steers students away from using ridesharing or competitor services.


5.5.2. Potential Allys
A potential supporter is the Environment Canterbury Regional Council. The organisation provides support to community projects that align with their priorities and beliefs such as kaitiakitanga and focusing on environmental issues (Environment Canterbury Regional Council, 2023a, 2023b). To reinforce and foster this potential relationship, we can offer incentives and advantages that can encourage them to support our cause and objectives. This could be future collaborative projects or an expansion of this campaign which will benefit both parties. It is important to show that we share the same values and beliefs as the organisation. We can do this through extensive research of their mission statements and previous actions to achieve goals to ensure both parties align and are working towards common goals. Participating in joint advocacy efforts would be beneficial to demonstrate a united front and show that we want to amplify other shared messages that align with their organisation.
5.6. Policy

There are a variety of ongoing policy initiatives that would help create an environment to encourage sustainable transport use. The Ministry for the Environment has a direct policy action labelled “Support people to walk, cycle and use sustainable transport” (NZ Ministry for the Environment, 2022). The Ministry plans to improve the reach, frequency, and quality of sustainable transport by delivering a sustainable transport strategy alongside major sustainable service and infrastructure improvements in larger New Zealand cities including Christchurch (NZ Ministry for the Environment, 2022). The Government transport outcomes framework (NZ Ministry of Transport, 2020, p5) provides a system that aims to improve wellbeing and liveability through transport. Influencing factors include inclusive access, healthy and safe people, economic prosperity, environmental sustainability, and resilience and security (NZ Ministry of Transport, 2020). Encouraging use of this framework is crucial to develop an environment for behaviour change that links to our survey results. Commonly Individuals believed that transport was not entirely accessible for everyone [See Figure.4], causing them to rely on personal transport. Having greater access would give individuals the opportunity to take sustainable transport and encourage behavioural change. Investment funding addressing the reliability, accessibility, and quality of sustainable transport is also taking place. Currently, “The Government is investing $78 million to accelerate the greater Christchurch sustainable transport futures bus improvements programme…” (Wood, 2023).


6. Monitoring Plan
To measure this campaign, two measurements will be used; the number of tertiary bus card scans over the campaign period, and data from a self-rated scale survey. Measuring an increase in sustainable transport usage is simple, as the number of tertiary bus scans over the campaign period can be compared to the previous 3-month period. Measuring audience knowledge and attitudes provide a bit more of a challenge. Prior to the launch of the campaign, a self-rated survey will be undertaken among the target audience. This survey will be distributed in person by people on university campuses, and the university’s email to students. It will ask about their levels of knowledge to metro, Christchurch cycleways, and other sustainable transport. It will also ask for their attitudes towards using these modes of transport. The same survey will be conducted at the end of the campaign [90 days] to measure the increase/decrease in knowledge and attitudes. A further survey will be sent out to participants who responded to the final survey, 3 weeks after it is distributed, to measure whether these behaviours have continued. The ideal number of participants in these surveys is five hundred respondents.
Figure 6.
Monitoring Plan Timeline
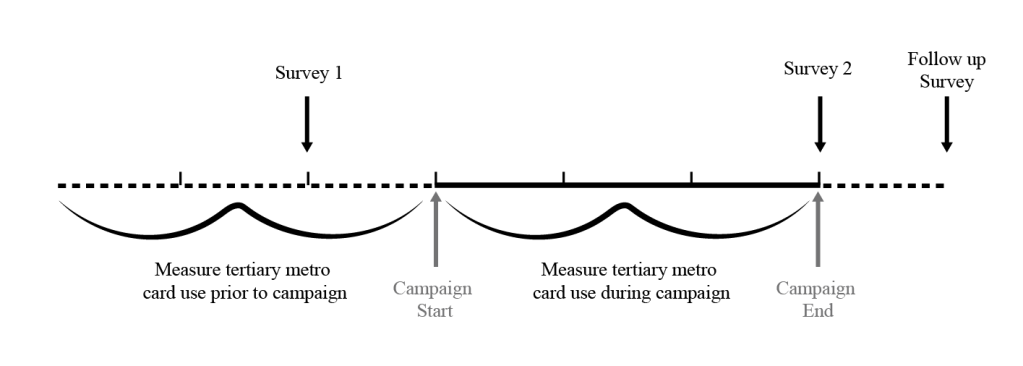
Note: Vertical dashes on timeline indicate 30-day periods
7. Appendix
7.1. Figures from Servey Data
A survey of classmates was taken through google forms to gauge perceptions of sustainable transport and their barriers among students. The following figures are the graphing of the survey data, created in Microsoft excel.
Figure 1.
Agreement with Statement “Driving is more cost effective than taking the bus in Christchurch.”

Figure 2.
Agreement with Statement “Riding the bus in Christchurch is cool.”

Figure 3.
Agreement with Statement “Biking in Christchurch is faster than driving.”

Figure 4.
What are the main barriers to…
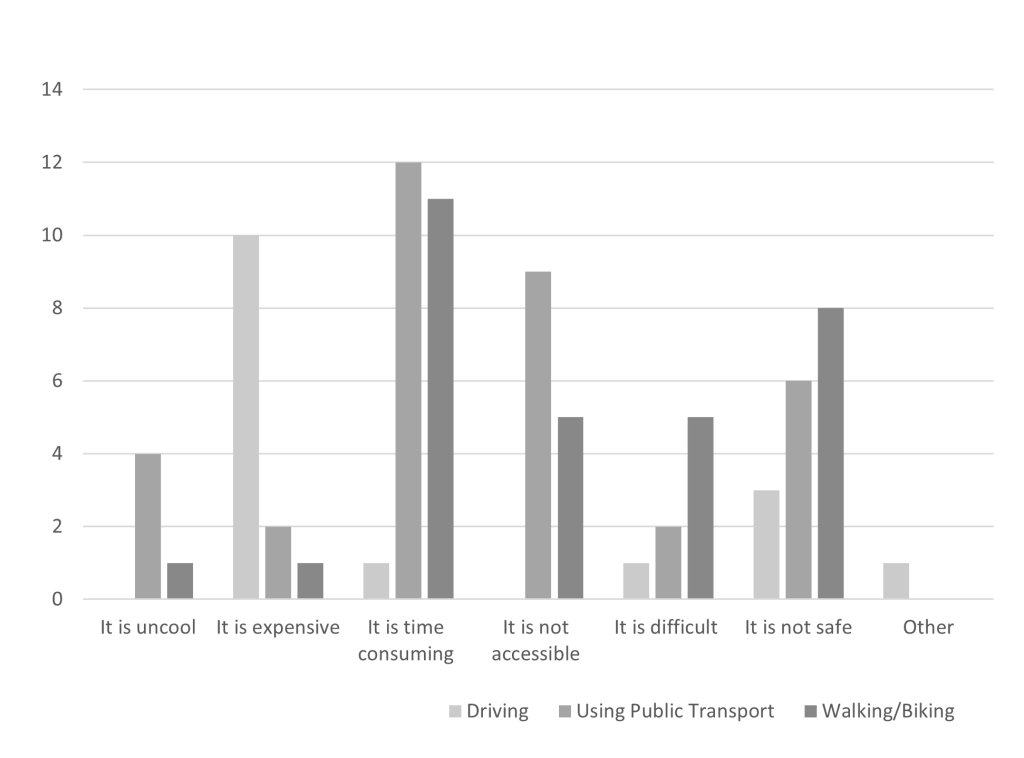
Figure 5.
Hypothetical Situation: If there was a bus stop outside your house, which went to location you needed to go, as well as adequate bike lanes would you:

7.2. Tarpare Tables
Table 1.
Number of Halls of Residence Students
| Hall of Residence | Student Capacity |
|---|---|
| Arcady Hall | 169 |
| College House | 159 |
| Ilam Student Apartments | 847* |
| Kirkwood Avenue Hall | 64 |
| Rochester and Rutherford Hall | 192 |
| Tupuānuku | 375 |
| University Hall | 533 |
| TOTAL | 2339 (*1915.5) |
Note: Hayashi, Kirkwood flats, and Sonoda Christchurch Campus have been excluded from this table as they do not cater to first year students
* Up to 50% of these students in Ilam Student apartments are first year students, bringing the actual figure to 423.5; corrected figure in total
Table 2.
Total population of residents living in rural and sub-rural areas surrounding Christchurch
| Statistical Area | Population |
|---|---|
| Ashgrove | 1,530 |
| Brooklands-Spencerville | 735 |
| Diamond Harbour | 1,497 |
| Governors Bay | 864 |
| Kaiapoi Central | 2,169 |
| Kaiapoi North West | 2,085 |
| Kaiapoi South | 1,827 |
| Kaiapoi West | 1,257 |
| Kingsbury | 2,778 |
| Lilybrook | 2,949 |
| Lincoln East | 3,567 |
| Lincoln South | 2,550 |
| Lincoln West | 2,943 |
| Lyttelton | 2,982 |
| Oxford Estate | 1,314 |
| Pegasus | 2,637 |
| Pegasus Bay | 1,047 |
| Prebbleton | 4,515 |
| Rangiora Central | 36 |
| Rangiora North East | 1,812 |
| Rangiora North West | 2,133 |
| Rangiora South East | 2,178 |
| Rangiora South West | 2,340 |
| Ravenswood | 1,878 |
| Rolleston Central | 3,258 |
| Rolleston Izone | 33 |
| Rolleston North East | 4,554 |
| Rolleston North West | 3,777 |
| Rolleston South East | 3,036 |
| Rolleston South West | 2,874 |
| Southbrook | 771 |
| Sovereign Palms | 3,405 |
| Templeton | 1,797 |
| Waikuku Beach | 1,635 |
| West Melton | 2,085 |
| Woodend | 2,784 |
| TOTAL | 79,632 |
Note: This number is an estimate, at this time some statistical areas have changed or were not included due to a lack of available recent data.
Table 3.
TAPARE analysis on potential target audiences
| Target Group | Group Size (# population) | At risk status | Persuasibility | Accessibility | Resources | Equity | Total Score |
|---|---|---|---|---|---|---|---|
| Non-Sustainable Transport Users in Christchurch | 269,005 | 4 | 3 | 4 | 3 | 3 | 17 |
| Rural Commuters from surrounding Christchurch area | 79,632* | 3 | 2 | 1 | 2 | 3 | 11 |
| First Year University Students | 1,915✝ | 3 | 5 | 5 | 4 | 2 | 19 |
*See table 2
✝See table 1
Table 4.
Specific TAPARE analysis on first year university students at the University of Canterbury
| Element | Explanation |
|---|---|
| Total Number | 1915 first year students living in halls of residence (See table.1). |
| At Risk Population | Those who have not purchased personal vehicles [future cost reduction], those who have purchased personal vehicles [current cost reduction]. |
| Persuasibility | Younger audiences are more likely to engage and advocate for sustainable behaviours than other age groups (Nadeem, 2021), educated people are also more likely to engage in these practices (Piao & Managi, 2023). |
| Accessibility | Easy to access through partnerships, often around a concentrated area [university campus]. |
| Resources | Partnerships with the University. |
| Equity | Often high debt, low income (Small, 2022). Students at halls of residence may have little outgoings. |
References
Click to open Refernce List
Australian Bureau of Statistics. (2008, July 23). Chapter – Public transport use for work and study. Www.abs.gov.au.
Boddy, S., & Kassirer, J. (2013). Portland’s Smart Trips Welcome Program (p. 10) [Case Study]. Tools of Change. https://toolsofchange.com/userfiles/SmartTrips%20Landmark%20case%20studyV4.pdf
Christchurch City Council. (2023a). Christchurch bike map. Christchurch City Council. https://ccc.govt.nz/transport/getting-around/cycling/cycling-maps/
Christchurch City Council. (n.d.-b). Cycling. Christchurch City Council. Retrieved October 21, 2023, from https://ccc.govt.nz/transport/getting-around/cycling/
Donovan, R. J., Egger, G., & Francas, M. (1999). TARPARE: A method for selecting target audiences for public health interventions. Australian and New Zealand Journal of Public Health, 23(3), 280–284. https://doi.org/10.1111/j.1467-842X.1999.tb01256.x
Environment Canterbury Regional Council. (2023a). Our values. Environment Canterbury. https://www.ecan.govt.nz/about/your-council/about-us/our-values/
Environment Canterbury Regional Council. (2023b). Types of support. Environment Canterbury. https://www.ecan.govt.nz/get-involved/support/types-of-support/
EHINZ. (2018). Main mode of transport to work. Environmental Health Intelligence New Zealand. https://www.ehinz.ac.nz/indicators/transport/main-mode-of-transport-to-work/
Greater Christchurch Partnership. (2021). Public transport. Greater Christchurch Partnership. https://api.everviz.com/share/rJE9QTMsz
Kennedy, A.-M. (2023, July 21). Intro to Social Marketing and finding a problem. https://learn.canterbury.ac.nz/mod/resource/view.php?id=3196631
McFarland, M. (2019, April 25). Uber wants to compete with public transit. These experts are horrified | CNN Business. CNN. https://www.cnn.com/2019/04/25/tech/uber-public-transportation/index.html
Metro. (n.d.-a). Fares | Metro Christchurch. Www.metroinfo.co.nz. Retrieved October 2023, from https://www.metroinfo.co.nz/travel-and-fares-info/fares/
Metro. (n.d.-b). Maps and timetables | Metro Christchurch. Www.metroinfo.co.nz. Retrieved October 2023, from https://www.metroinfo.co.nz/timetables/
Moovit. (2023a, July 10). Metro Christchurch, Christchurch – bus Schedules, Routes & Updates. https://moovitapp.com/index/en-gb/public_transportation-lines-Christchurch-2202-776157
Moovit. (2023b, September 10). NZ Bus, Wellington – bus Schedules, Routes & Updates. https://moovitapp.com/index/en-gb/public_transportation-lines-Wellington-785-1210505
Nadeem, R. (2021, May 26). Gen Z, Millennials Stand Out for Climate Change Activism, Social Media Engagement With Issue. Pew Research Center Science & Society. https://www.pewresearch.org/science/2021/05/26/gen-z-millennials-stand-out-for-climate-change-activism-social-media-engagement-with-issue/
National Social Marketing Centre. (2010). Choose How You Move (p. 10) [Case Study]. National Social Marketing Centre. https://www.thensmc.com/resources/showcase/choose-how-you-move
NZ Ministry for the Environment. (2022). Te hau mārohi ki anamata Towards a productive, sustainable and inclusive economy: Aotearoa New Zealand’s first emissions reduction plan (Government Report ME 1639; pp. 167–198). Ministry for the Environment. https://environment.govt.nz/publications/aotearoa-new-zealands-first-emissions-reduction-plan/
NZ Ministry of Transport. (2020). Te Tauākī Kaupapa Here a te Kāwanatanga mō ngā waka whenua 2021 | Government Policy Statement on land transport 2021 (p. 59) [Government Report]. Ministry of Transport. https://www.transport.govt.nz/area-of-interest/strategy-and-direction/government-policy-statement-on-land-transport-2021/
Piao, X., & Managi, S. (2023). The international role of education in sustainable lifestyles and economic development. Scientific Reports, 13(1), Article 1. https://doi.org/10.1038/s41598-023-35173-w
Quester, P. G., Pettigrew, S., Kopanidis, F., Hill, S. R., & Hawkins, D. I. (2014). Consumer Behaviour: Implications for marketing strategy (7th ed.). McGraw-Hill Education (Australia) Ply Ltd. https://go.exlibris.link/G4j75Ctm
Statistics NZ. (2018a). 2018 Census place summaries. Stats NZ. https://www.stats.govt.nz/tools/2018-census-place-summaries/
Statistics NZ. (2018b). Place Summaries | Christchurch City | Stats NZ. Stats NZ. https://www.stats.govt.nz/tools/2018-census-place-summaries/christchurch-city
Small, Z. (2022, August 25). Cost of rent higher than student income—Research. Newshub. https://www.newshub.co.nz/home/new-zealand/2022/08/cost-of-rent-higher-than-student-income-research.html
Uber Technologies Inc. (2021). Form 10-K 2021 (SEC Filing 001–38902). Securities and Exchange Commission. https://www.sec.gov/Archives/edgar/data/1543151/000154315122000008/uber-20211231.htm
University of Canterbury. (2023a). Campus cycling services and facilities | Life at UC. The University of Canterbury. Retrieved October 2023, from https://www.canterbury.ac.nz/life/sustainability/sustainable-operations/transport-options/cycling/services/
University of Canterbury. (2023b). 2024 Accomodation Guide. https://www.canterbury.ac.nz/life/accommodation/halls/arcady-hall/accommodation-guide.pdf
Wood, Hon. M. (2023). Government delivers better public transport for Christchurch. [Press Release] Government of New Zealand. https://www.beehive.govt.nz/release/government-delivers-better-public-transport-christchurch