


Often New Zealand is often referred to as an egalitarian society, and while there is increasing evidence showing pay-gaps in New Zealand have decreased over the years, pay-gaps none the less still remain; a pay-gap in sex, ethnicity, age, and work type are among some of the many variables that make up these gaps’ existence. With pay-gaps currently decreasing, it should be noted that this slow closing is not due to one single factor; studies undertaken in different work sectors/industries have shown each industry may have their own individualized factor[s] at play. An argument often made within this, is that within the gender pay-gap, men often dominate particular industries makeups, resulting a more spacious pay-gap due to a lower female participation rate. However, investigating this in New Zealand’s workforce shows that the pay-gap is not the result of workforce makeups, but instead due to multiple factors, explained and unexplained.
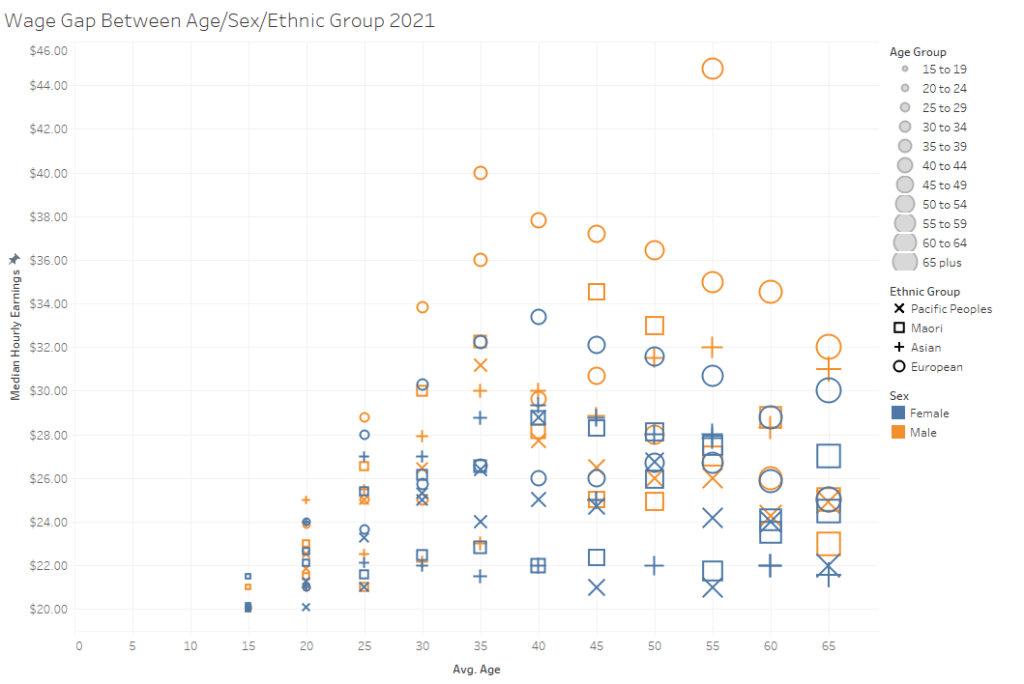
While most of this paper focuses its interest primarily on the gender pay-gap in New Zealand, it is important to note that a strong pay-gap exists in New Zealand not only between sex, but also between ethnicity and age. When compiling age, with ethnic group and gender, a clear trend emerges [figure 1]. Often those who are of European decent, males, and between the ages of 35 and 55 earn far more per hour than anyone else. Age can arguably be considered a reasonable factor when it comes to earnings, as wages/promotions can often correlate with experience or time worked for a company, but ethnicity and gender should not automatically be a defining factor of financial success in a supposably egalitarian nation. Unfortunately, if you are a Pacifica woman of any age in 2021, then the statistics point to show that you will tend to receive the lowest median hourly income of any group. When it comes to Pacifica individuals alone, over half tend to make less than $30,000 per year (Statistics NZ, 2021d), whereas half of those of European descent make less than $35,000.
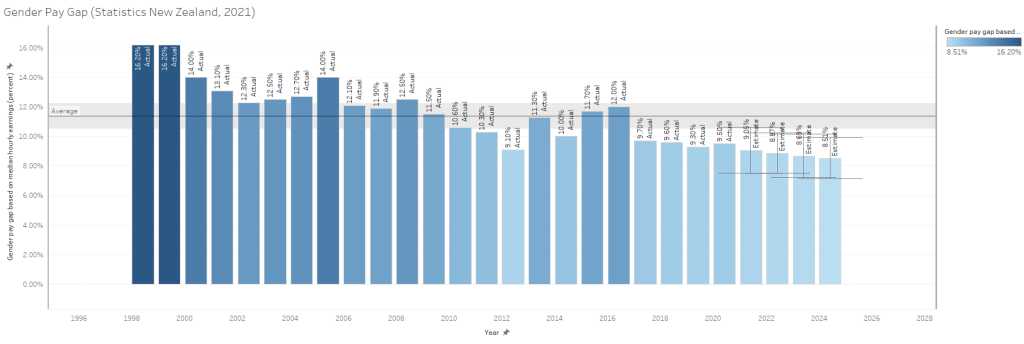
Regarding the gender pay-gap, it is estimated by Statistics NZ (Statistics New Zealand, 2021) that the current Gender pay-gap in New Zealand sits at 9.09%. This shows a comparable difference to the pay-gap in 1998 when Statistics New Zealand [Stats NZ] began monitoring this gap. In 1998, the gap sat at 16.20%, meaning over a 21-year period, the gap between men and women’s pay has fallen by 56.23%. If current trends continue, this is estimated to fall below 9% in 2022; however, forecasting this trend indicates that it will not be until 2050 that the pay-gap falls below 5% [figure 2]. To measure this, Stats NZ uses median pay as to account for ‘untypical’ individuals who earn higher amounts, which may distort results (Statistics New Zealand, 2014). To avoid confusion and allow for data continuity, calculations of the pay-gap in this paper will be made using median pay.
The gap between men and women’s pay in New Zealand has been attempted to be explained by a number of factors; including but not limited to discrimination, tendency for women to favor part-time work, time spent working for a company, psychological factors, and life choices. A 2017 report commissioned by the Ministry for Women found that 83% of factors that may impact the gender pay-gap in New Zealand remain unexplained (Pacheco et al., 2017). These factors may be better explained when research is carried out on a smaller scale, investigating the pay-gap in particular industries, businesses, or work types. For example, a study into the pay-gap between academic researchers found that despite women improving research scores/quality at a higher average than men, they were less likely to be promoted at a similar rate to their male counterparts (Brower & James, 2020, p.5). Around 50% of this gap can be explained by lower research outputs. Researchers hypothesize that a portion of the other 50% may be due to an unobservable factor they have coined as ‘the double whammy effect’, where “… universities over-demand and under-reward women’s teaching and service…” (p.7-13). Another study found a 12.5% gap in pay between New Zealand medical specialists who had worked the same hours and had the same roles. It is suggested that 36% of this gap can be explained by differences in experience (Sin et al., 2021), however, this leaves 64% of this gap also determined by unexplained factors. This shows that industry-based research can provide insights into the prevalence of individual factors in New Zealand that may influence the pay-gap in particular industries. It is unlikely that these studies will have significant quantitative findings to deconstruct the pay-gap on a macro level; however, they do contribute to building a bigger understanding and picture of factors that actually makes up the pay-gaps in New Zealand.
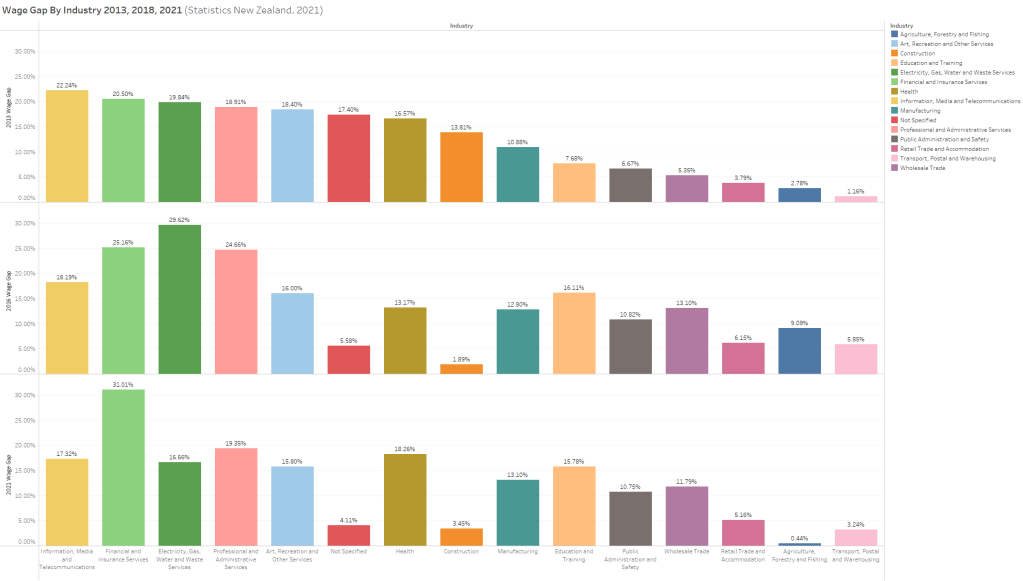
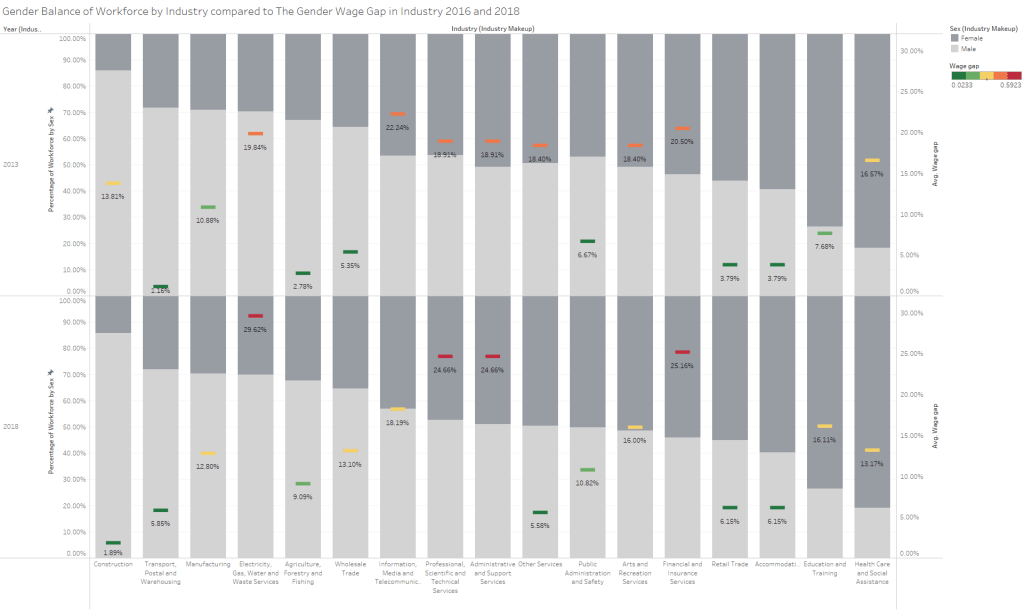
When looking at the pay-gap in individual industries, it is clear pay-gap in most industries rose between 2013 and 2018, however, by 2021 industries had seen a decrease in their pay-gaps, with exception of Financial and Insurance Services, which rose from a 25.16% pay-gap to 31.01% [figure 3]. In 2021 we can see the largest gap persists in financial and insurance services and Professional and Administration services. However, industries which would typically be considered male dominated such as Agriculture, Forestry and Fishing; Transport, Postal and Warehouse; along with Construction, are the only industries which have a pay-gap less than 5%.
A commonly used argument in justifying the gender pay-gap is that men make up a majority of workforces in particular industries, resulting in a greater pay-gap in those industries. To test this, census data (Statistics NZ, 2021c) can used to identify majority gender dominated industries– those with a sex composition higher than 60% of their workforce [figure 5]. Then the change in the gender balance of a workforce can be used to compare with an individual industry’s pay-gap change over time.
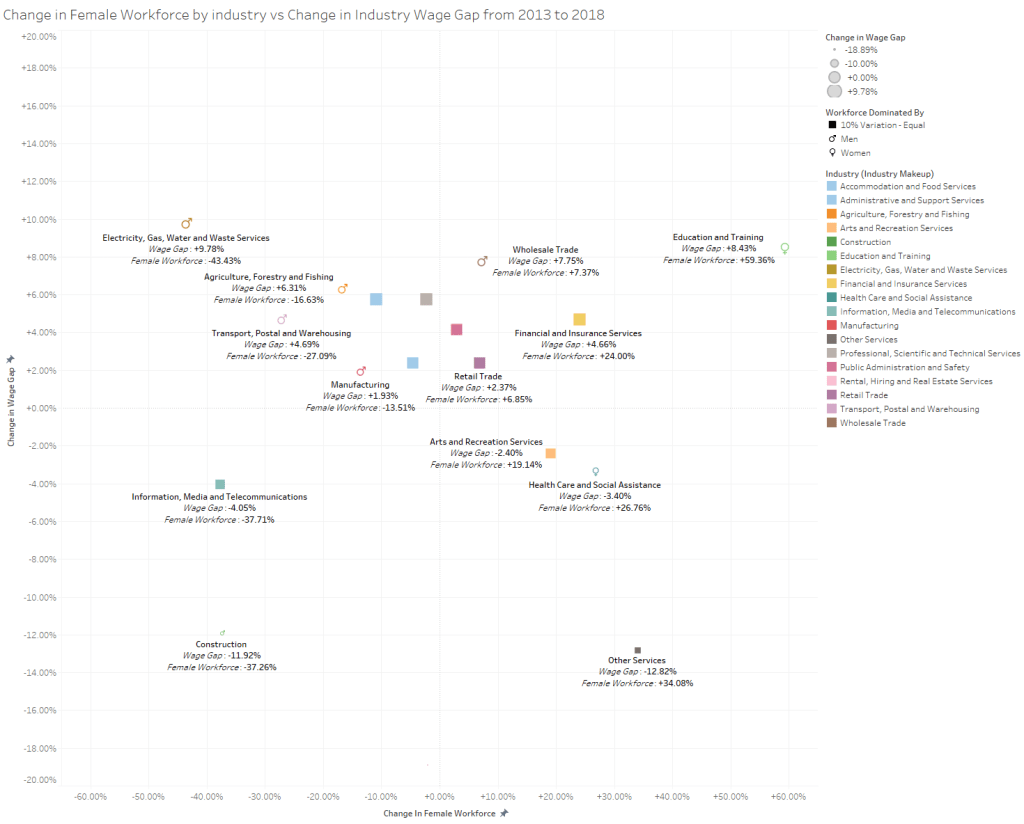
With the exception of Electricity, Gas, Water and Waste Services; and other outliers, shown by the data in figure 4, no clear trend emerges. This shows that the pay-gap is likely not strongly effected by an industries overall gender make up in New Zealand and is more likely affected by other factors. A 2021 report from Global Women (Global Women & Champions for Change, 2021, p.15) found that on average women hold less than 35% of board, executive and managerial positions in New Zealand. Electricity, Gas, Water and Waste Services is made up of a majority male workforce, and it is therefore likely that these upper positions [which are generally paid more], are also likely held by mostly men; this would explain this outlier, and others alike where their female workforce makeup has decreased by a large percentage and so has their pay-gap.
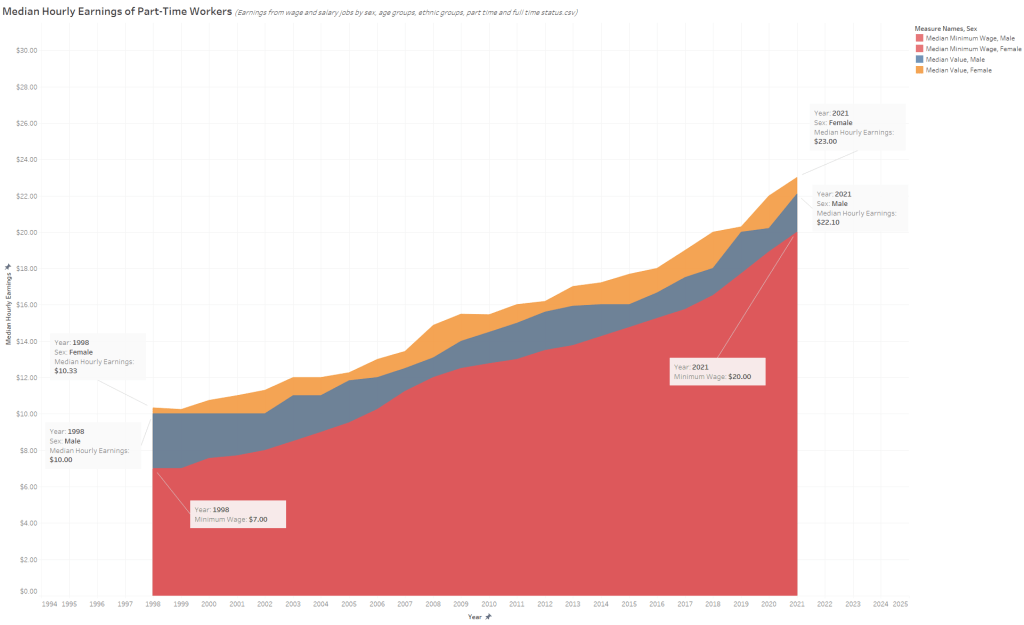
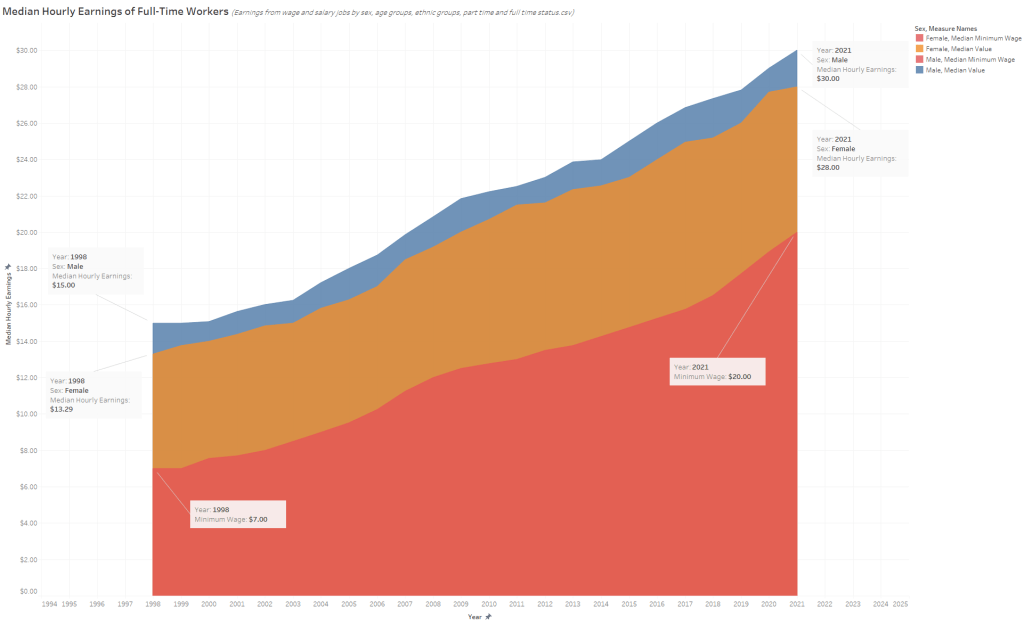
Stats NZ also advises against measuring the pay-gap based of part-time vs full-time workers separately, as it may change the balance of factors influencing pay such as age or pay based on the type of jobs that offer part-time work (Statistics New Zealand, 2014). However, there is an argument to be made that measuring the gap differently between these two types of work will provide better insights to help explain the gender pay-gap in each of those work types and offer more opportunities for suggestions to close the gap. When comparing work types among New Zealanders, in Full-time work, men tend to earn a higher median hourly wage than women [figure 6]; however, the opposite is shown when comparing part-time work, where women tend to earn more than men [figure 7]. The opportunity of working part-time is determined by a number of factors influenced by outside and internal forces, such as personal choice, looking after family, work opportunity, education, etc. Much of part-time work is reliant on these factors, so it may be more desirable for researchers to focus efforts in closing the gap within full-time work over part-time in order to achieve pay-parity faster.
While there does not appear to be one single solution to close the pay-gap due to the multitude of explained and unexplained factors that need to be addressed in each individual industry or work type in New Zealand, there are general steps that can be taken on all levels to assist closing the gap going forward. A report commissioned by Glassdoor Economic Research (Chamberlain et al., 2019) suggests 3 main steps to improve the gap; for job seekers to seek out pay information and understand their own value, for employers to share pay information with candidates and employees, and for policymakers to promote family leave and invest in policies and programs that encourage workplace diversity (p.73).
New Zealand clearly has an ongoing equity issue regarding the many pay-gaps present and the size of them. Large gaps still exist on the basis of gender, ethnicity, age, and even experience. Pacifica women are still at the bottom end of median hourly earnings since pay-gap recording has been undertaken, and while trends of pay-gaps getting smaller are good to see, the rate in which they are decreasing are not viable for New Zealand to be considered a fully egalitarian society. More research being undertaken in the industries and private sector are promising, however legislation into pay reporting and reviews as suggested may be a way to help increase this rate of pay-gaps decline.
Figures
References
Click to open reference list
Brower, A., & James, A. (2020). Research performance and age explain less than half of the gender pay gap in New Zealand universities. https://doi.org/10.1371/journal.pone.0226392
Chamberlain, A., Zhao, D., & Stansell, A. (2019). Progress on the Gender Pay Gap: 2019. 79.
Global Women & Champions for Change. (2021). Diversity & Inclusion Impact 2021 (p. 42). Global Women. https://www.globalwomen.org.nz/wp-content/uploads/2021/12/GW-Diversity-and-Inclusion-Report.pdf
Pacheco, G., Li, C., & Cochrane, B. (2017). Empirical evidence of the gender pay gap in New Zealand. Ministry for Women. https://women.govt.nz/sites/public_files/Empirical%20evidence%20of%20GPG%20in%20NZ%20-%20Mar2017_0.pdf
Sin, I., Bruce-Brand, B., & Chambers, C. N. L. (2021). The gender wage gap among medical specialists: A quantitative analysis of the hourly pay of publicly employed senior doctors in New Zealand. BMJ Open, 11(4). http://dx.doi.org/10.1136/bmjopen-2020-045214
Statistics New Zealand. (2014). Measuring the gender pay gap. https://www.stats.govt.nz/assets/Uploads/Methods/Measuring-the-gender-pay-gap/measuring-gender-pay-gap-corrected.pdf
Statistics New Zealand. (2021, November 17). Gender and ethnic pay gaps: Stats NZ’s action plan 2021/2022 | Stats NZ. https://stats.govt.nz/corporate/gender-and-ethnic-pay-gaps-stats-nzs-action-plan-20212022
Statistics NZ. (n.d.). “Gender pay gap for all groups” (CSV, 6Kb) [Data Set]. Learn. https://learn.canterbury.ac.nz/pluginfile.php/4271396/mod_folder/content/0/Gender%20pay%20gap%20for%20all%20age%20groups.csv?forcedownload=1
Statistics NZ. (2021a). “Earnings from main wage and salary job by industry (ANZSIC 2006), sex, age groups, and ethnic groups” (CSV,117Kb) [Data Set]. https://nzdotstat.stats.govt.nz/wbos/Index.aspx?DataSetCode=TABLECODE7472#
Statistics NZ. (2021b). “Earnings from wage and salary jobs by sex, age groups, ethnic groups and full-time and part-time status” (CSV, 2.6Mb) [Data Set]. Learn. https://learn.canterbury.ac.nz/pluginfile.php/4271396/mod_folder/content/0/Earnings%20from%20wage%20and%20salary%20jobs%20by%20sex%2C%20age%20groups%2C%20ethnic%20groups%2C%20part%20time%20and%20full%20time%20status.csv?forcedownload=1
Statistics NZ. (2021c). Industry (division) and ethnic group (grouped total responses) by sex, for the employed census usually resident population count aged 15 years and over, 2006, 2013, and 2018 Censuses (RC, TA, SA2, DHB) Information on table. [Data Set] https://nzdotstat.stats.govt.nz/wbos/Index.aspx?DataSetCode=TABLECODE7472#
Statistics NZ. (2021d). “Total personal income, work and labour force status, and ethnic group (grouped total responses) by age group and sex, for the census usually resident population count aged 15 years and over, 2013 and 2018 Censuses (RC, TA, DHB) ” (.Xls, 30Kb). [Data Set] https://nzdotstat.stats.govt.nz/wbos/Index.aspx?DataSetCode=TABLECODE7472#


Leave a comment